Mục lục:

If you have been involved in forex trading, you are undoubtedly familiar with popular oscillators such as RSI, MACD, Stochastic… Understanding and understanding the oscillator is essential. To help investors analyze the market, increase trading efficiency. In this article, Kienthuccoin will learn about the indicator with you. What is Stochastic? How to read the Stochastic Oscillator indicator and how to use Stochastic effectively.
What is Stochastic?
Have you ever heard of leading or lagging indicators? To invest in forex trading successfully, you need to know terms like bullish or bearish divergence, oversold or overbought conditions, and unique signals to trade in the market appropriately reasonable.
Stochastic is an indicator that compares a specific closing price with a range of prices over a particular period. This indicator works effectively even when the market is changing rapidly. Therefore, this is a significant indicator that investors need to understand.
Dr. George Lane invented stochastic in the 1950s. Stochastic is still widely used today.
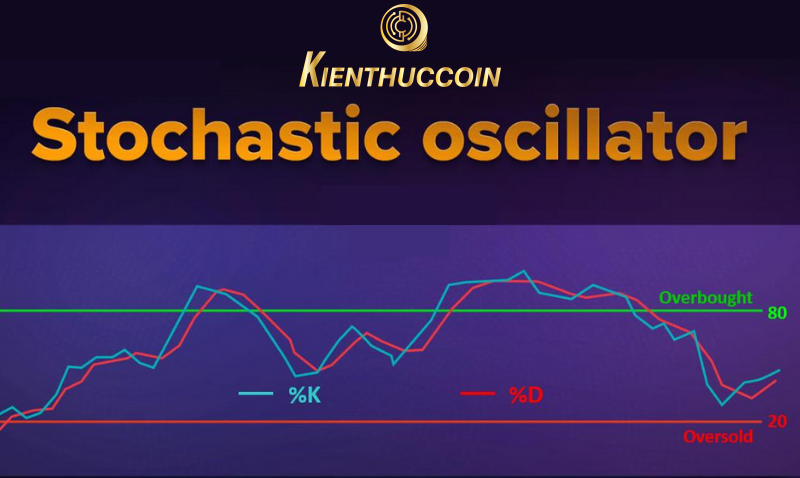
Each Stochastic indicator uses two lines, %K and %D, where:
- %K is the fast Stoch line, usually represented by a solid blue line on the MT4 chart,
- %D is the slow Stoch line, traditionally represented by the dashed red line on the MT4 graph,
%K and %D are calculated according to the following formula:
Slow %K= 100 [Sum (C – L14) of %K Slowing Period / Total (H14 – L14) of %K Slowing Period]
Slow %D = SMA of Slow %K
Where:
- C = the most recent closing price
- L14 = the lowest low of the last 14 sessions
- H14 = the highest high of the last 14 sessions
- %K Slowing Period = 3.
It is pretty complicated, but traders don't need to worry about the calculation because the charting software can now handle complex formulas and sum them up—1 Stochastic Oscillator.
Stochastic – Early Indicator
Although it is just one of many tools used in technical analysis, Stochastic is extremely important. The difference between an early indicator like Stochastic with a lagging indicator is an early indicator that changes before price action while lagging indicator changes with price movement.
How to read the Stochastic Oscillator

The Stochastic indicator has a range of 0 to 100. The above 80 represents overbought, and below 20 is oversold.
Price rallies often run out of momentum when Stochastic enters the overbought zone. When Stochastic returns an oversold result, it is a sign that the devaluation process has ended.
In addition, investors also need to pay attention to trend reversal warning signals that appear when the %K (blue)and line the %D (red) line intersect in the overbought (above 80.00) or oversold area. (under 20.00).
– Buy signal: %K line crosses %D line from below up in the oversold area.
– Sell signal: the %K line crosses the %D line from above in the overbought area.
Specifically, Kienthuccoin analyzed one chart below:

The chart above shows that Bitcoin has dropped by 11% after Stochastic returned a sell signal on June 9. However, BTC rallied more than 8% when the oscillator showed a buy signal on June 29.
Conclusion
Above, Kienthuccoin has synthesized knowledge about Stochastic early indicators, guided you to the Stochastic Oscillator and important notes when using Stochastic indicator. Hopefully, through this lesson, you can apply it in practice to trade effectively.
What are some frequently asked questions about Stochastic?
What is the meaning of the Stochastic indicator?
The meaning and operation of the indicators help investors place orders more effectively and bring success.
- Helping investors identify overbought and oversold zones.
Stochastic has range bounds between 0 and 100. This makes it a helpful tool for identifying overbought and oversold zones. If it is above 80, it will be in the overbought zone, and below 20 will be in the oversold zone.
Strong price trends can sustain overbought or oversold conditions for a long time. Instead, traders should combine Stochastic with other indicators to make better judgments.
- The reverse signal provided to help investors determine when to command
The Stochastic graph typically includes two lines: one line reflects the real value of the Stochastic% K% D is an average of% K.
When prices are Believed to follow momentum, the crossover of these two lines is seen as a signal that a reversal might be in the works. This signal shows a significant change in price momentum within a cycle.
What should be noted when using the Stochastic indicator?
Based on the Stochastic indicator, it is possible to determine the overbought and oversold points of the market to enter orders. However, in the process of trading, investors must also understand the following rules:
- There is no single indicator capable of giving 100% accurate signals, so combining it with other types of hands is necessary. Other to determine market trends for accuracy.
- Stochastic indicators in larger frames will give more accurate and less misleading signals.
How to combine Stochastic with Moving Average to find trend trading signals?
Moving Average is a tool used to identify trends. Therefore, investors can combine the indicator Stochastic with the Moving Average to find trading signals following the upcoming trend with a high standard.
Instructions on how to trade when traders combine Stochastic – Moving Average:
Buy signal:
- Price is above the Moving Average
- line %K line crosses above the %D line in the oversold area Sell
Sell signal:
- Price is below Moving Average
- The %K line cuts below the %D line in the overbought area.
Investors can set a stop loss below the Moving Average when trading in an uptrend. Or place on the Moving Average line while trading in a downtrend. Pay attention to taking profit with a 2:1 ratio of stop loss.


